When I started to think about how to share this chart, I thought about writing a long introduction about the importance of tracking your workouts, screening and testing and the process how you end up with a specific rep/set scheme and why. Maybe I’ll write about that later, today I want to keep it simple:
The following table and the quick guide how to use it has arisen from the question: “I can do x Reps with y kg, what do you think I can do for z Reps?” (with {x, y, z} ∈ ℕ)
Most of the training population has experienced that the number of maximal repetitions depends on the weight you take. With a high Intensity (≈Weight) you can only do low Volume (≈Reps) and vice versa. Several studies have investigated the relationship between intensity and the possible volume. The relationship can be expressed in percentage of one maximal repetition (1RM) and can also be used to compare different intensities. Long story short, here’s the chart.
Quick Guide:
1.) Search the weight you do now in the respective rep row (e.g. 24kg for 10 Reps
2.) Move up/down in the column to the row of the goal-repetitions (e.g. 5 Reps)
3.) Go to work (e.g. 28kg for 5 Reps)
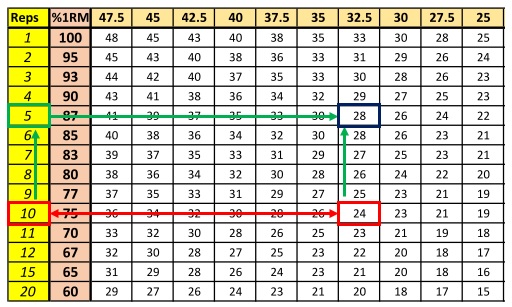
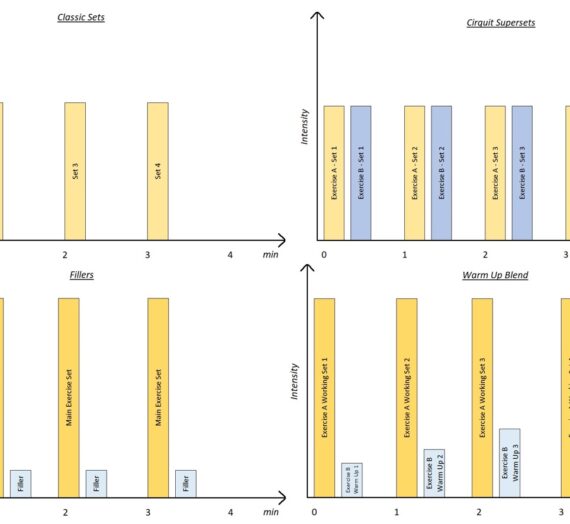
Notes: The Chart is generalized so it may not suit every person strength profile perfectly: Still I think it is a valuable chart to have to help finding corresponding weights. Especially when you want to try out things like pyramid sets etc.
That’s it, that’s all, feedback always welcome.